machine configuration is optional. Using higher spec machines will increase the cost of running the task but can also improve the performance of the task if it is CPU or memory bound.
/trigger/heavy-task.ts
import { task } from "@trigger.dev/sdk";

export const heavyTask = task({
  id: "heavy-task",
  machine: "large-1x",
  run: async ({ payload, ctx }) => {
    //...
  },
});
small-1x which has 0.5 vCPU and 0.5 GB of RAM. You can change the default machine in your trigger.config.ts file:
trigger.config.ts
import type { TriggerConfig } from "@trigger.dev/sdk";

export const config: TriggerConfig = {
  machine: "small-2x",
  // ... other config
};
Machine configurations
| Preset | vCPU | Memory | Disk space |
|---|---|---|---|
| micro | 0.25 | 0.25 | 10GB |
| small-1x (default) | 0.5 | 0.5 | 10GB |
| small-2x | 1 | 1 | 10GB |
| medium-1x | 1 | 2 | 10GB |
| medium-2x | 2 | 4 | 10GB |
| large-1x | 4 | 8 | 10GB |
| large-2x | 8 | 16 | 10GB |
Overriding the machine when triggering
You can also override the task machine when you trigger it:await tasks.trigger<typeof heavyTask>(
"heavy-task",
{ message: "hello world" },
{ machine: "large-2x" }
);
Out Of Memory (OOM) errors
Sometimes you might see one of your runs fail with an “Out Of Memory” error.TASK_PROCESS_OOM_KILLED. Your run was terminated due to exceeding the machine’s memory limit. Try increasing the machine preset in your task options or replay using a larger machine.We automatically detect common Out Of Memory errors:
- When using Node.js, if the V8 heap limit is exceeded (this can happen when creating large long-lived objects)
- When the entire process exceeds the memory limit of the machine the run is executing on.
- When a child process, such as ffmpeg, causes the memory limit of the machine to be exceeded, and exits with a non-zero code.
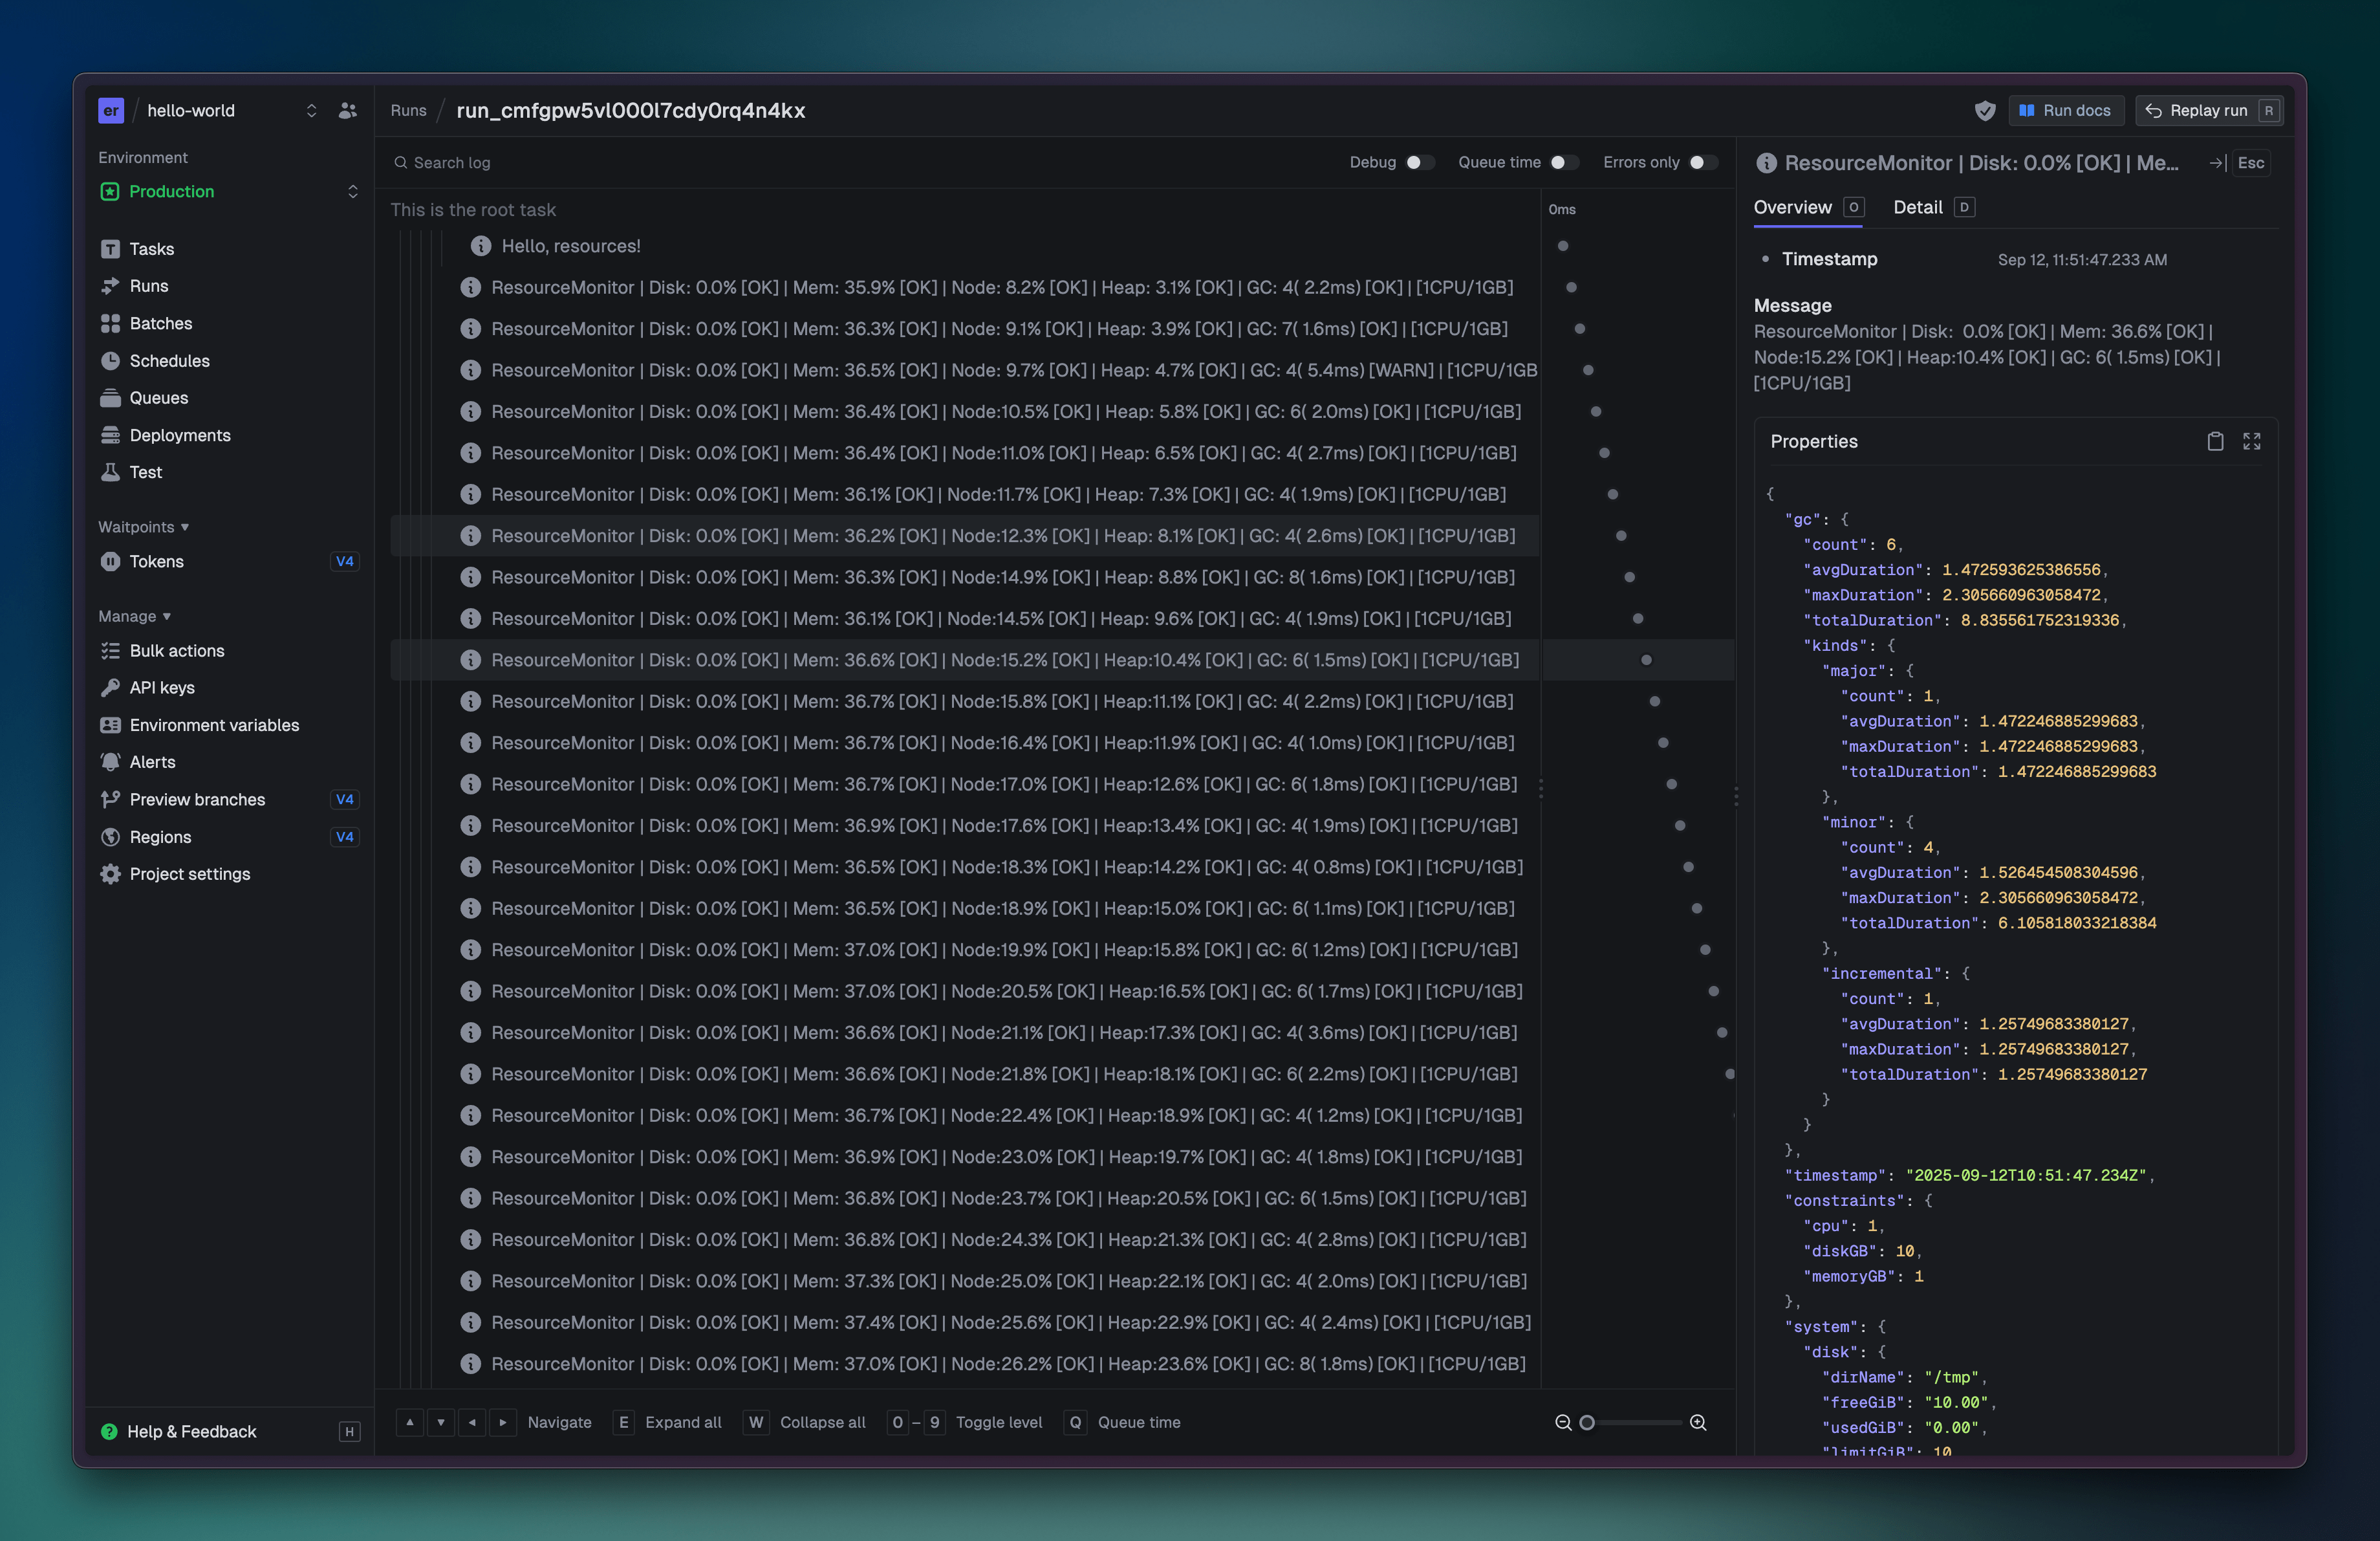
Memory/Resource monitoring
To better understand why an OOM error occurred, we’ve published a helper class that will log memory debug information at regular intervals. First, add thisResourceMonitor class to your project:
View ResourceMonitor class
View ResourceMonitor class
/src/resourceMonitor.ts
import { promisify } from "node:util";
import { exec } from "node:child_process";
import os from "node:os";
import { promises as fs } from "node:fs";
import { type Context, logger } from "@trigger.dev/sdk";
import { getHeapStatistics } from "node:v8";
import { PerformanceObserver, constants } from "node:perf_hooks";

const execAsync = promisify(exec);

export type DiskMetrics = {
  total: number;
  used: number;
  free: number;
  percentUsed: number;
  warning?: string;
};

export type MemoryMetrics = {
  total: number;
  free: number;
  used: number;
  percentUsed: number;
};

export type NodeProcessMetrics = {
  memoryUsage: number;
  memoryUsagePercent: number;
  heapUsed: number;
  heapSizeLimit: number;
  heapUsagePercent: number;
  availableHeap: number;
  isNearHeapLimit: boolean;
};

export type TargetProcessMetrics = {
  method: string;
  processName: string;
  count: number;
  processes: ProcessInfo[];
  averages: {
    cpu: number;
    memory: number;
    rss: number;
    vsz: number;
  } | null;
  totals: {
    cpu: number;
    memory: number;
    rss: number;
    vsz: number;
  } | null;
};

export type ProcessMetrics = {
  node: NodeProcessMetrics;
  targetProcess: TargetProcessMetrics | null;
};

type GCSummary = {
  count: number;
  totalDuration: number; // ms
  avgDuration: number; // ms
  maxDuration: number; // ms
  kinds: Record<
    string,
    {
      // breakdown by kind
      count: number;
      totalDuration: number;
      avgDuration: number;
      maxDuration: number;
    }
  >;
};

type ProcessInfo = {
  user: string;
  pid: number;
  cpu: number;
  mem: number;
  vsz: number;
  rss: number;
  command: string;
};

export type SystemMetrics = {
  disk: DiskMetrics;
  memory: MemoryMetrics;
};

export type ResourceMonitorConfig = {
  dirName?: string;
  processName?: string;
  ctx: Context;
  compactLogging?: boolean;
};

// Constants
const DISK_LIMIT_GB = 10;
const DISK_LIMIT_BYTES = DISK_LIMIT_GB * 1024 * 1024 * 1024; // 10Gi in bytes

export class ResourceMonitor {
  private logInterval: NodeJS.Timeout | null = null;
  private logger: typeof logger;
  private dirName: string;
  private processName: string | undefined;
  private ctx: Context;
  private verbose: boolean;
  private compactLogging: boolean;
  private gcObserver: PerformanceObserver | null = null;
  private bufferedGcEntries: PerformanceEntry[] = [];

  constructor(config: ResourceMonitorConfig) {
    this.logger = logger;
    this.dirName = config.dirName ?? "/tmp";
    this.processName = config.processName;
    this.ctx = config.ctx;
    this.verbose = true;
    this.compactLogging = config.compactLogging ?? false;
  }

  /**
   * Start periodic resource monitoring
   * @param intervalMs Monitoring interval in milliseconds
   */
  startMonitoring(intervalMs = 10000): void {
    if (intervalMs < 1000) {
      intervalMs = 1000;
      this.logger.warn("ResourceMonitor: intervalMs is less than 1000, setting to 1000");
    }

    if (this.logInterval) {
      clearInterval(this.logInterval);
    }

    this.logInterval = setInterval(this.logResources.bind(this), intervalMs);

    this.gcObserver = new PerformanceObserver((list) => {
      this.bufferedGcEntries.push(...list.getEntries());
    });

    this.gcObserver.observe({ entryTypes: ["gc"], buffered: true });
  }

  /**
   * Stop resource monitoring
   */
  stopMonitoring(): void {
    if (this.logInterval) {
      clearInterval(this.logInterval);
      this.logInterval = null;
    }

    if (this.gcObserver) {
      this.gcObserver.disconnect();
      this.gcObserver = null;
    }
  }

  private async logResources() {
    try {
      await this.logResourceSnapshot("ResourceMonitor");
    } catch (error) {
      this.logger.error(
        `Resource monitoring error: ${error instanceof Error ? error.message : String(error)}`
      );
    }
  }

  /**
   * Get combined system metrics (disk and memory)
   */
  private async getSystemMetrics(): Promise<SystemMetrics> {
    const [disk, memory] = await Promise.all([this.getDiskMetrics(), this.getMemoryMetrics()]);
    return { disk, memory };
  }

  /**
   * Get disk space information
   */
  private async getDiskMetrics(): Promise<DiskMetrics> {
    try {
      // Even with permission errors, du will output a total
      const { stdout, stderr } = await execAsync(`du -sb ${this.dirName} || true`);

      // Get the last line of stdout which contains the total
      const lastLine = stdout.split("\n").filter(Boolean).pop() || "";
      const usedBytes = parseInt(lastLine.split("\t")[0], 10);

      const effectiveTotal = DISK_LIMIT_BYTES;
      const effectiveUsed = Math.min(usedBytes, DISK_LIMIT_BYTES);
      const effectiveFree = effectiveTotal - effectiveUsed;
      const percentUsed = (effectiveUsed / effectiveTotal) * 100;

      const metrics: DiskMetrics = {
        total: effectiveTotal,
        used: effectiveUsed,
        free: effectiveFree,
        percentUsed,
      };

      // If we had permission errors, add a warning
      if (stderr.includes("Permission denied") || stderr.includes("cannot access")) {
        metrics.warning = "Some directories were not accessible";
      } else if (stderr.includes("No such file or directory")) {
        metrics.warning = "The directory does not exist";
      }

      return metrics;
    } catch (error) {
      this.logger.error(
        `Error getting disk metrics: ${error instanceof Error ? error.message : String(error)}`
      );
      return {
        free: DISK_LIMIT_BYTES,
        total: DISK_LIMIT_BYTES,
        used: 0,
        percentUsed: 0,
        warning: "Failed to measure disk usage",
      };
    }
  }

  /**
   * Get memory metrics
   */
  private getMemoryMetrics(): MemoryMetrics {
    const total = os.totalmem();
    const free = os.freemem();
    const used = total - free;
    const percentUsed = (used / total) * 100;

    return { total, free, used, percentUsed };
  }

  /**
   * Get process-specific metrics using /proc filesystem
   */
  private async getProcMetrics(pids: number[]): Promise<ProcessInfo[]> {
    return Promise.all(
      pids.map(async (pid) => {
        try {
          // Read process status
          const status = await fs.readFile(`/proc/${pid}/status`, "utf8");
          const cmdline = await fs.readFile(`/proc/${pid}/cmdline`, "utf8");
          const stat = await fs.readFile(`/proc/${pid}/stat`, "utf8");

          // Parse VmRSS (resident set size) from status
          const rss = parseInt(status.match(/VmRSS:\s+(\d+)/)?.[1] ?? "0", 10);
          // Parse VmSize (virtual memory size) from status
          const vsz = parseInt(status.match(/VmSize:\s+(\d+)/)?.[1] ?? "0", 10);
          // Get process owner
          const user = (await fs.stat(`/proc/${pid}`)).uid.toString();

          // Parse CPU stats from /proc/[pid]/stat
          const stats = stat.split(" ");
          const utime = parseInt(stats[13], 10);
          const stime = parseInt(stats[14], 10);
          const starttime = parseInt(stats[21], 10);

          // Calculate CPU percentage
          const totalTime = utime + stime;
          const uptime = os.uptime();
          const hertz = 100; // Usually 100 on Linux
          const elapsedTime = uptime - starttime / hertz;
          const cpuUsage = 100 * (totalTime / hertz / elapsedTime);

          // Calculate memory percentage against total system memory
          const totalMem = os.totalmem();
          const memoryPercent = (rss * 1024 * 100) / totalMem;

          return {
            user,
            pid,
            cpu: cpuUsage,
            mem: memoryPercent,
            vsz,
            rss,
            command: cmdline.replace(/\0/g, " ").trim(),
          };
        } catch (error) {
          return null;
        }
      })
    ).then((results) => results.filter((r): r is ProcessInfo => r !== null));
  }

  /**
   * Find PIDs for a process name using /proc filesystem
   */
  private async findPidsByName(processName?: string): Promise<number[]> {
    if (!processName) {
      return [];
    }

    try {
      const pids: number[] = [];
      const procDirs = await fs.readdir("/proc");

      for (const dir of procDirs) {
        if (!/^\d+$/.test(dir)) continue;

        const processPid = parseInt(dir, 10);

        // Ignore processes that have a lower PID than our own PID
        if (processPid <= process.pid) {
          continue;
        }

        try {
          const cmdline = await fs.readFile(`/proc/${dir}/cmdline`, "utf8");
          if (cmdline.includes(processName)) {
            pids.push(parseInt(dir, 10));
          }
        } catch {
          // Ignore errors reading individual process info
          continue;
        }
      }

      return pids;
    } catch {
      return [];
    }
  }

  /**
   * Get process-specific metrics
   */
  private async getProcessMetrics(): Promise<ProcessMetrics> {
    // Get Node.js process metrics
    const totalMemory = os.totalmem();
    // Convert GB to bytes (machine.memory is in GB)
    const machineMemoryBytes = this.ctx.machine
      ? this.ctx.machine.memory * 1024 * 1024 * 1024
      : totalMemory;
    const nodeMemoryUsage = process.memoryUsage();

    // Node process percentage is based on machine memory if available, otherwise system memory
    const nodeMemoryPercent = (nodeMemoryUsage.rss / machineMemoryBytes) * 100;
    const heapStats = getHeapStatistics();

    const nodeMetrics: NodeProcessMetrics = {
      memoryUsage: nodeMemoryUsage.rss,
      memoryUsagePercent: nodeMemoryPercent,
      heapUsed: nodeMemoryUsage.heapUsed,
      heapSizeLimit: heapStats.heap_size_limit,
      heapUsagePercent: (heapStats.used_heap_size / heapStats.heap_size_limit) * 100,
      availableHeap: heapStats.total_available_size,
      isNearHeapLimit: heapStats.used_heap_size / heapStats.heap_size_limit > 0.8,
    };

    let method = "ps";

    try {
      let processes: ProcessInfo[] = [];

      // Try ps first, fall back to /proc if it fails
      try {
        const { stdout: psOutput } = await execAsync(
          `ps aux | grep ${this.processName} | grep -v grep`
        );

        if (psOutput.trim()) {
          processes = psOutput
            .trim()
            .split("\n")
            .filter((line) => {
              const parts = line.trim().split(/\s+/);
              const pid = parseInt(parts[1], 10);

              // Ignore processes that have a lower PID than our own PID
              return pid > process.pid;
            })
            .map((line) => {
              const parts = line.trim().split(/\s+/);
              return {
                user: parts[0],
                pid: parseInt(parts[1], 10),
                cpu: parseFloat(parts[2]),
                mem: parseFloat(parts[3]),
                vsz: parseInt(parts[4], 10),
                rss: parseInt(parts[5], 10),
                command: parts.slice(10).join(" "),
              };
            });
        }
      } catch {
        // ps failed, try /proc instead
        method = "proc";
        const pids = await this.findPidsByName(this.processName);
        processes = await this.getProcMetrics(pids);
      }

      if (processes.length === 0) {
        return {
          node: nodeMetrics,
          targetProcess: this.processName
            ? {
                method,
                processName: this.processName,
                count: 0,
                processes: [],
                averages: null,
                totals: null,
              }
            : null,
        };
      }

      // For CPU:
      // - ps shows CPU percentage per core (e.g., 100% = 1 core)
      // - machine.cpu is in cores (e.g., 0.5 = half a core)
      // - we want to show percentage of allocated CPU (e.g., 100% = using all allocated CPU)
      const availableCpu = this.ctx.machine?.cpu ?? os.cpus().length;
      const cpuNormalizer = availableCpu * 100; // Convert to basis points for better precision with fractional CPUs

      // For Memory:
      // - ps 'mem' is already a percentage of system memory
      // - we need to convert it to a percentage of machine memory
      // - if machine memory is 0.5GB and system has 16GB, we multiply the percentage by 32
      const memoryScaleFactor = this.ctx.machine ? totalMemory / machineMemoryBytes : 1;

      const totals = processes.reduce(
        (acc, proc) => ({
          cpu: acc.cpu + proc.cpu,
          // Scale memory percentage to machine memory
          // TODO: test this
          memory: acc.memory + proc.mem * memoryScaleFactor,
          rss: acc.rss + proc.rss,
          vsz: acc.vsz + proc.vsz,
        }),
        { cpu: 0, memory: 0, rss: 0, vsz: 0 }
      );

      const count = processes.length;

      const averages = {
        cpu: totals.cpu / (count * cpuNormalizer),
        memory: totals.memory / count,
        rss: totals.rss / count,
        vsz: totals.vsz / count,
      };

      return {
        node: nodeMetrics,
        targetProcess: this.processName
          ? {
              method,
              processName: this.processName,
              count,
              processes,
              averages,
              totals: {
                cpu: totals.cpu / cpuNormalizer,
                memory: totals.memory,
                rss: totals.rss,
                vsz: totals.vsz,
              },
            }
          : null,
      };
    } catch (error) {
      return {
        node: nodeMetrics,
        targetProcess: this.processName
          ? {
              method,
              processName: this.processName,
              count: 0,
              processes: [],
              averages: null,
              totals: null,
            }
          : null,
      };
    }
  }

  /**
   * Log a snapshot of current resource usage
   */
  async logResourceSnapshot(label = "Resource Snapshot"): Promise<void> {
    try {
      const payload = await this.getResourceSnapshotPayload();
      const enhancedLabel = this.compactLogging
        ? this.createCompactLabel(payload, label)
        : this.createEnhancedLabel(payload, label);

      if (payload.process.node.isNearHeapLimit) {
        this.logger.warn(`${enhancedLabel}: Node is near heap limit`, payload);
      } else {
        this.logger.info(enhancedLabel, payload);
      }
    } catch (error) {
      this.logger.error(
        `Error logging resource snapshot: ${error instanceof Error ? error.message : String(error)}`
      );
    }
  }

  /**
   * Create an enhanced log label with key metrics for quick scanning
   */
  private createEnhancedLabel(payload: any, baseLabel: string): string {
    const parts: string[] = [baseLabel];

    // System resources with text indicators
    const diskPercent = parseFloat(payload.system.disk.percentUsed);
    const memoryPercent = parseFloat(payload.system.memory.percentUsed);
    const diskIndicator = this.getTextIndicator(diskPercent, 80, 90);
    const memIndicator = this.getTextIndicator(memoryPercent, 80, 90);
    parts.push(`Disk:${diskPercent.toFixed(1).padStart(5)}%${diskIndicator}`);
    parts.push(`Mem:${memoryPercent.toFixed(1).padStart(5)}%${memIndicator}`);

    // Node process metrics with text indicators
    const nodeMemPercent = parseFloat(payload.process.node.memoryUsagePercent);
    const heapPercent = parseFloat(payload.process.node.heapUsagePercent);
    const nodeIndicator = this.getTextIndicator(nodeMemPercent, 70, 85);
    const heapIndicator = this.getTextIndicator(heapPercent, 70, 85);
    parts.push(`Node:${nodeMemPercent.toFixed(1).padStart(4)}%${nodeIndicator}`);
    parts.push(`Heap:${heapPercent.toFixed(1).padStart(4)}%${heapIndicator}`);

    // Target process metrics (if available)
    if (payload.process.targetProcess && payload.process.targetProcess.count > 0) {
      const targetCpu = payload.process.targetProcess.totals?.cpuPercent || "0";
      const targetMem = payload.process.targetProcess.totals?.memoryPercent || "0";
      const targetCpuNum = parseFloat(targetCpu);
      const targetMemNum = parseFloat(targetMem);
      const cpuIndicator = this.getTextIndicator(targetCpuNum, 80, 90);
      const memIndicator = this.getTextIndicator(targetMemNum, 80, 90);
      parts.push(
        `${payload.process.targetProcess.processName}:${targetCpu.padStart(
          4
        )}%${cpuIndicator}/${targetMem.padStart(4)}%${memIndicator}`
      );
    }

    // GC activity with performance indicators
    if (payload.gc && payload.gc.count > 0) {
      const avgDuration = payload.gc.avgDuration;
      const gcIndicator = this.getTextIndicator(avgDuration, 5, 10, true);
      parts.push(
        `GC:${payload.gc.count.toString().padStart(2)}(${avgDuration
          .toFixed(1)
          .padStart(4)}ms)${gcIndicator}`
      );
    }

    // Machine constraints
    if (payload.constraints) {
      parts.push(`[${payload.constraints.cpu}CPU/${payload.constraints.memoryGB}GB]`);
    }

    // Warning indicators (only show critical ones in the main label)
    const criticalWarnings: string[] = [];
    if (payload.process.node.isNearHeapLimit) criticalWarnings.push("HEAP_LIMIT");
    if (diskPercent > 90) criticalWarnings.push("DISK_CRITICAL");
    if (memoryPercent > 95) criticalWarnings.push("MEM_CRITICAL");
    if (payload.system.disk.warning) criticalWarnings.push("DISK_WARN");

    if (criticalWarnings.length > 0) {
      parts.push(`[${criticalWarnings.join(",")}]`);
    }

    return parts.join(" | ");
  }

  /**
   * Get text-based indicator for percentage values
   */
  private getTextIndicator(
    value: number,
    warningThreshold: number,
    criticalThreshold: number,
    isDuration = false
  ): string {
    if (isDuration) {
      // For duration values, higher is worse
      if (value >= criticalThreshold) return " [CRIT]";
      if (value >= warningThreshold) return " [WARN]";
      return " [OK]";
    } else {
      // For percentage values, higher is worse
      if (value >= criticalThreshold) return " [CRIT]";
      if (value >= warningThreshold) return " [WARN]";
      return " [OK]";
    }
  }

  /**
   * Create a compact version of the enhanced label for high-frequency logging
   */
  private createCompactLabel(payload: any, baseLabel: string): string {
    const parts: string[] = [baseLabel];

    // Only show critical metrics in compact mode
    const diskPercent = parseFloat(payload.system.disk.percentUsed);
    const memoryPercent = parseFloat(payload.system.memory.percentUsed);
    const heapPercent = parseFloat(payload.process.node.heapUsagePercent);

    // Use single character indicators for compactness
    const diskIndicator = diskPercent > 90 ? "!" : diskPercent > 80 ? "?" : ".";
    const memIndicator = memoryPercent > 95 ? "!" : memoryPercent > 80 ? "?" : ".";
    const heapIndicator = heapPercent > 85 ? "!" : heapPercent > 70 ? "?" : ".";

    parts.push(`D:${diskPercent.toFixed(0).padStart(2)}%${diskIndicator}`);
    parts.push(`M:${memoryPercent.toFixed(0).padStart(2)}%${memIndicator}`);
    parts.push(`H:${heapPercent.toFixed(0).padStart(2)}%${heapIndicator}`);

    // GC activity (only if significant)
    if (payload.gc && payload.gc.count > 0 && payload.gc.avgDuration > 2) {
      const gcIndicator =
        payload.gc.avgDuration > 10 ? "!" : payload.gc.avgDuration > 5 ? "?" : ".";
      parts.push(`GC:${payload.gc.count}${gcIndicator}`);
    }

    return parts.join(" ");
  }

  async getResourceSnapshotPayload() {
    const [systemMetrics, processMetrics] = await Promise.all([
      this.getSystemMetrics(),
      this.getProcessMetrics(),
    ]);

    const gcSummary = summarizeGCEntries(this.bufferedGcEntries);
    this.bufferedGcEntries = [];

    const formatBytes = (bytes: number) => (bytes / (1024 * 1024)).toFixed(2);
    const formatPercent = (value: number) => value.toFixed(1);

    return {
      system: {
        disk: {
          limitGiB: DISK_LIMIT_GB,
          dirName: this.dirName,
          usedGiB: (systemMetrics.disk.used / (1024 * 1024 * 1024)).toFixed(2),
          freeGiB: (systemMetrics.disk.free / (1024 * 1024 * 1024)).toFixed(2),
          percentUsed: formatPercent(systemMetrics.disk.percentUsed),
          warning: systemMetrics.disk.warning,
        },
        memory: {
          freeGB: (systemMetrics.memory.free / (1024 * 1024 * 1024)).toFixed(2),
          percentUsed: formatPercent(systemMetrics.memory.percentUsed),
        },
      },
      gc: gcSummary,
      constraints: this.ctx.machine
        ? {
            cpu: this.ctx.machine.cpu,
            memoryGB: this.ctx.machine.memory,
            diskGB: DISK_LIMIT_BYTES / (1024 * 1024 * 1024),
          }
        : {
            cpu: os.cpus().length,
            memoryGB: Math.floor(os.totalmem() / (1024 * 1024 * 1024)),
            note: "Using system resources (no machine constraints specified)",
          },
      process: {
        node: {
          memoryUsageMB: formatBytes(processMetrics.node.memoryUsage),
          memoryUsagePercent: formatPercent(processMetrics.node.memoryUsagePercent),
          heapUsedMB: formatBytes(processMetrics.node.heapUsed),
          heapSizeLimitMB: formatBytes(processMetrics.node.heapSizeLimit),
          heapUsagePercent: formatPercent(processMetrics.node.heapUsagePercent),
          availableHeapMB: formatBytes(processMetrics.node.availableHeap),
          isNearHeapLimit: processMetrics.node.isNearHeapLimit,
          ...(this.verbose
            ? {
                heapStats: getHeapStatistics(),
              }
            : {}),
        },
        targetProcess: processMetrics.targetProcess
          ? {
              method: processMetrics.targetProcess.method,
              processName: processMetrics.targetProcess.processName,
              count: processMetrics.targetProcess.count,
              averages: processMetrics.targetProcess.averages
                ? {
                    cpuPercent: formatPercent(processMetrics.targetProcess.averages.cpu * 100),
                    memoryPercent: formatPercent(processMetrics.targetProcess.averages.memory),
                    rssMB: formatBytes(processMetrics.targetProcess.averages.rss * 1024),
                    vszMB: formatBytes(processMetrics.targetProcess.averages.vsz * 1024),
                  }
                : null,
              totals: processMetrics.targetProcess.totals
                ? {
                    cpuPercent: formatPercent(processMetrics.targetProcess.totals.cpu * 100),
                    memoryPercent: formatPercent(processMetrics.targetProcess.totals.memory),
                    rssMB: formatBytes(processMetrics.targetProcess.totals.rss * 1024),
                    vszMB: formatBytes(processMetrics.targetProcess.totals.vsz * 1024),
                  }
                : null,
            }
          : null,
      },
      timestamp: new Date().toISOString(),
    };
  }
}

function summarizeGCEntries(entries: PerformanceEntry[]): GCSummary {
  if (entries.length === 0) {
    return {
      count: 0,
      totalDuration: 0,
      avgDuration: 0,
      maxDuration: 0,
      kinds: {},
    };
  }

  let totalDuration = 0;
  let maxDuration = 0;
  const kinds: Record<string, { count: number; totalDuration: number; maxDuration: number }> = {};

  for (const e of entries) {
    const duration = e.duration;
    totalDuration += duration;
    if (duration > maxDuration) maxDuration = duration;

    const kind = kindName((e as any)?.detail?.kind ?? "unknown");
    if (!kinds[kind]) {
      kinds[kind] = { count: 0, totalDuration: 0, maxDuration: 0 };
    }
    kinds[kind].count += 1;
    kinds[kind].totalDuration += duration;
    if (duration > kinds[kind].maxDuration) kinds[kind].maxDuration = duration;
  }

  // finalize averages
  const avgDuration = totalDuration / entries.length;
  const kindsWithAvg: GCSummary["kinds"] = {};
  for (const [kind, stats] of Object.entries(kinds)) {
    kindsWithAvg[kind] = {
      count: stats.count,
      totalDuration: stats.totalDuration,
      avgDuration: stats.totalDuration / stats.count,
      maxDuration: stats.maxDuration,
    };
  }

  return {
    count: entries.length,
    totalDuration,
    avgDuration,
    maxDuration,
    kinds: kindsWithAvg,
  };
}

const kindName = (k: number | string) => {
  if (typeof k === "number") {
    return (
      {
        [constants.NODE_PERFORMANCE_GC_MAJOR]: "major",
        [constants.NODE_PERFORMANCE_GC_MINOR]: "minor",
        [constants.NODE_PERFORMANCE_GC_INCREMENTAL]: "incremental",
        [constants.NODE_PERFORMANCE_GC_WEAKCB]: "weak-cb",
      }[k] ?? `kind:${k}`
    );
  }
  return k;
};
ResourceMonitor class and start monitoring memory, disk, and CPU usage:
/src/trigger/example.ts
import { task, logger, wait } from "@trigger.dev/sdk";
import { ResourceMonitor } from "../resourceMonitor.js";

// Middleware to enable the resource monitor
tasks.middleware("resource-monitor", async ({ ctx, next }) => {
  const resourceMonitor = new ResourceMonitor({
    ctx,
  });

  // Only enable the resource monitor if the environment variable is set
  if (process.env.RESOURCE_MONITOR_ENABLED === "1") {
    resourceMonitor.startMonitoring(1_000);
  }

  await next();

  resourceMonitor.stopMonitoring();
});

export const resourceMonitorTest = task({
  id: "resource-monitor-test",
  run: async (payload: any, { ctx }) => {
    const interval = createMemoryPressure();

    await setTimeout(180_000);

    clearInterval(interval);

    return {
      message: "Hello, resources!",
    };
  },
});
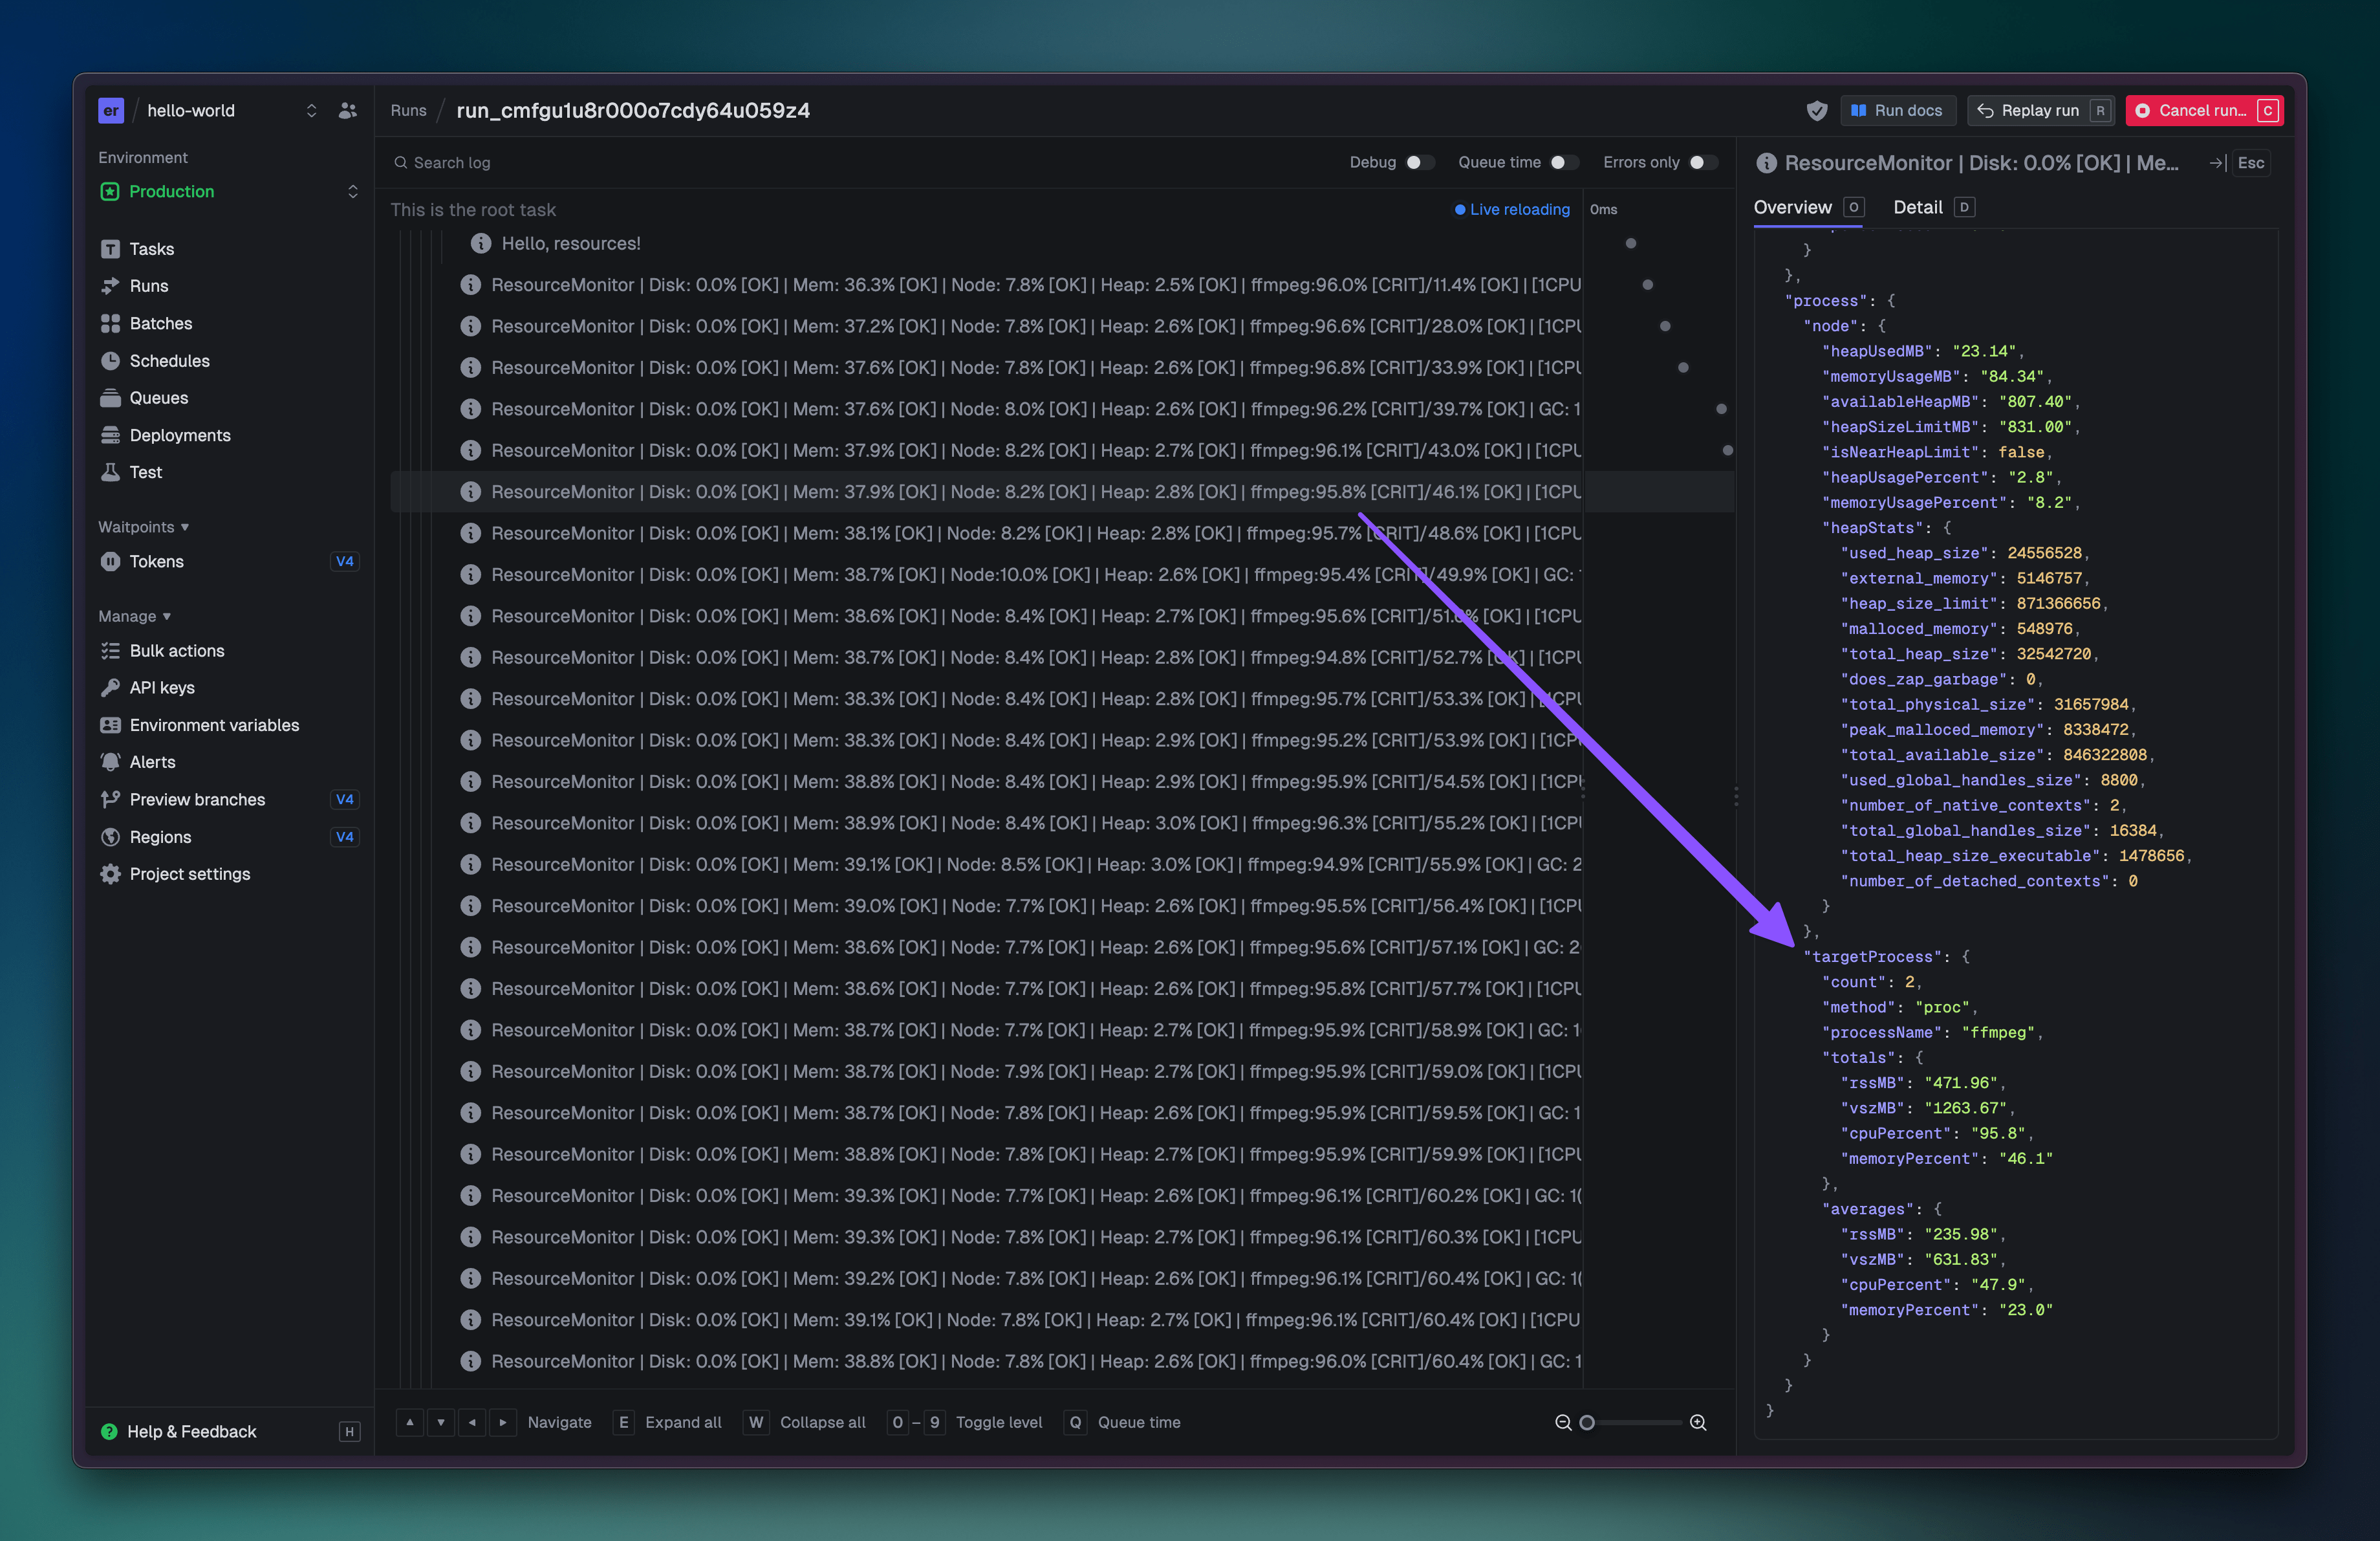
processName option to the ResourceMonitor class:
/src/trigger/example.ts
const resourceMonitor = new ResourceMonitor({
  ctx,
  processName: "ffmpeg",
});
ffmpeg process:
Explicit OOM errors
You can explicitly throw an Out Of Memory error in your task. This can be useful if you use a native package that detects it’s going to run out of memory and then stops before it runs out. If you can detect this, you can then throw this error./trigger/heavy-task.ts
import { task } from "@trigger.dev/sdk";
import { OutOfMemoryError } from "@trigger.dev/sdk";

export const yourTask = task({
  id: "your-task",
  machine: "medium-1x",
  run: async (payload: any, { ctx }) => {
    //...

    throw new OutOfMemoryError();
  },
});
Retrying with a larger machine
If you are seeing rare OOM errors, it might make sense to add a setting to your task to retry with a large machine when an OOM happens:/trigger/heavy-task.ts
import { task } from "@trigger.dev/sdk";

export const yourTask = task({
  id: "your-task",
  machine: "medium-1x",
  retry: {
    outOfMemory: {
      machine: "large-1x",
    },
  },
  run: async (payload: any, { ctx }) => {
    //...
  },
});
This will only retry the task if you get an OOM error. It won’t permanently change the machine
that a new run starts on, so if you consistently see OOM errors you should change the machine in
the
machine property.